How were the EQUISYM indicators chosen?
The EQUISYM indicators were inspired by veterinarians and their method of analysing asymmetry during a locomotor examination. During a dynamic assessment of the horse, the veterinarian focuses on key anatomical points, including the head, withers and croup. These points enable the detection of lameness, among other things. EQUISYM therefore measures the vertical displacement of these points using maximum, minimum and amplitude indicators.
These indicators are illustrated using curves and cursors. They are supplemented by information/tools such as standard deviations, video synchronisation and condition comparisons.
Analysis of vertical displacement asymmetries
Read a curve
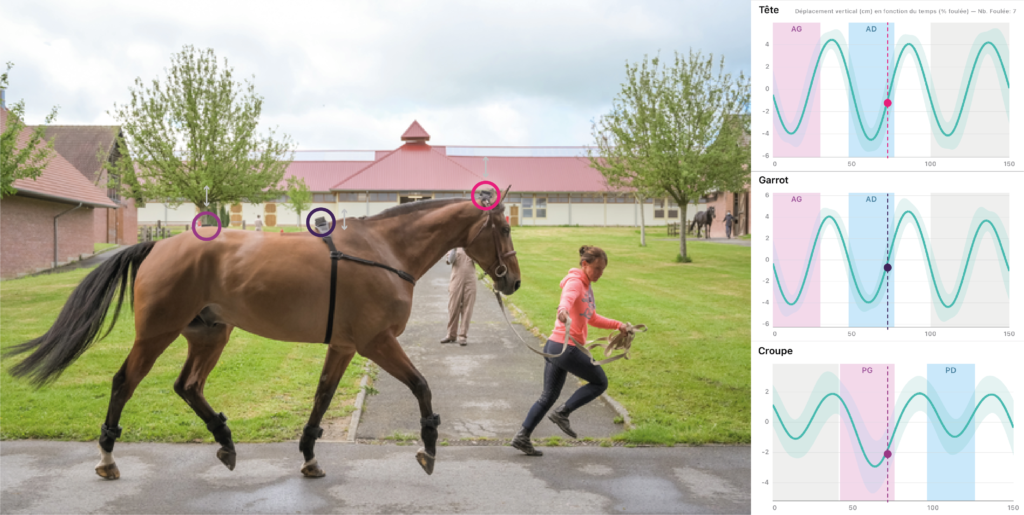
Below, we will break down the analysis of a stride to better understand how the horse’s vertical movement is translated by the EQUISYM curves. For the sake of clarity, the maximum, minimum and amplitude indices have not been displayed, but you can easily access them when navigating the application.
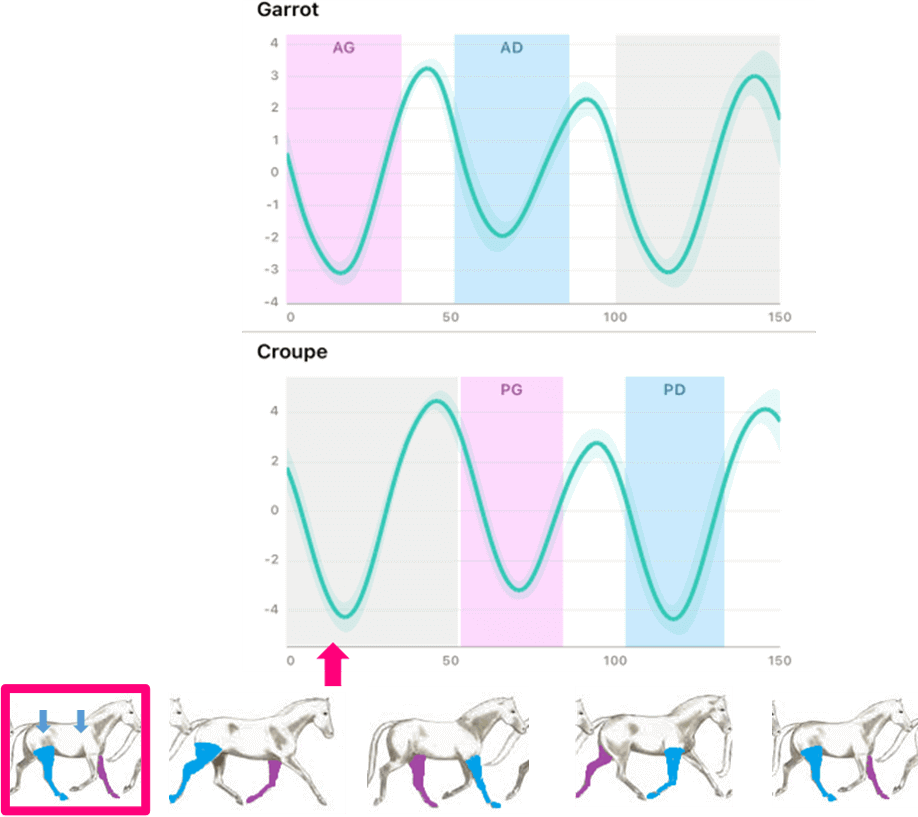
Ground phase – Left diagonal First suspension phase
The horse is in a landing phase, descending and putting weight on its left forelimb and right hindlimb
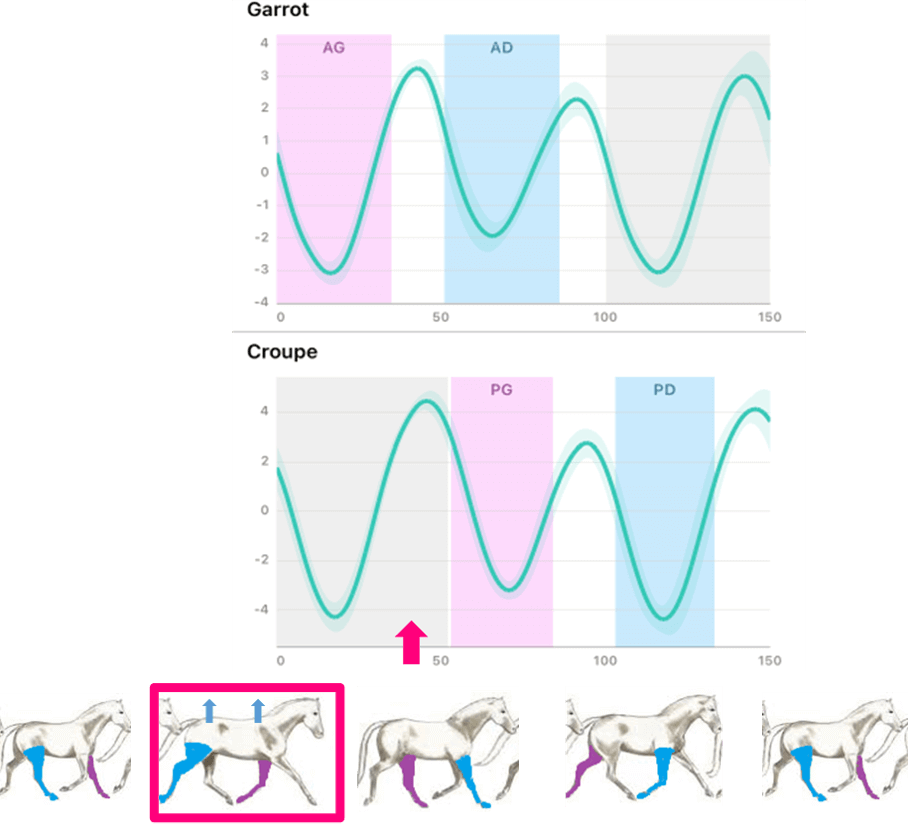
The horse elevates its withers and pelvis after propulsion on the left diagonal (left front leg and right hind leg).
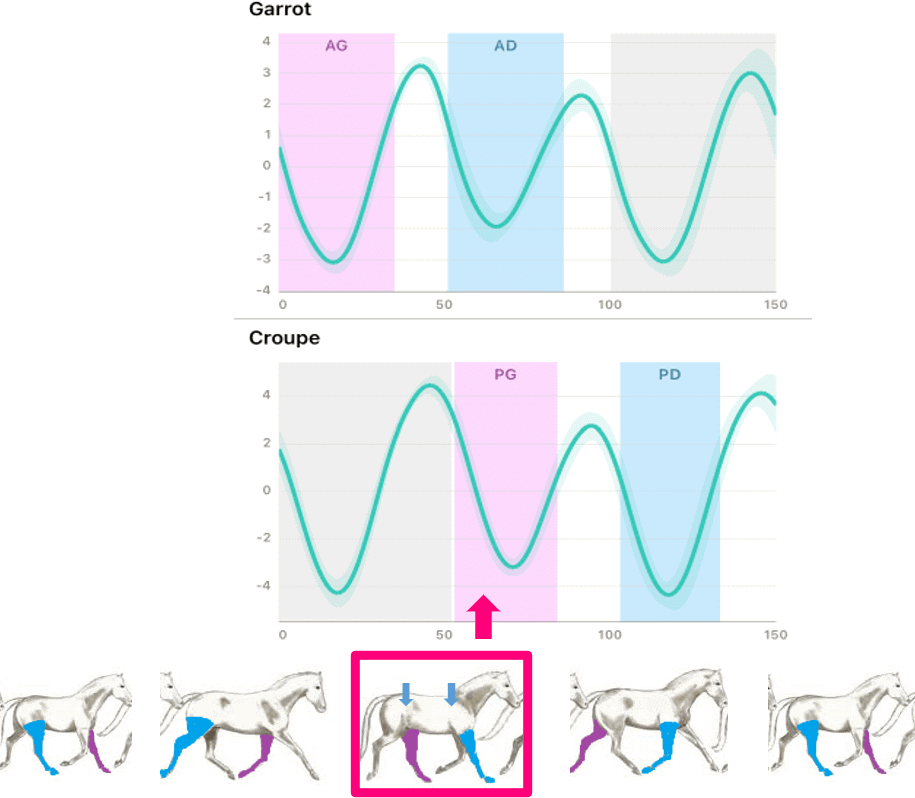
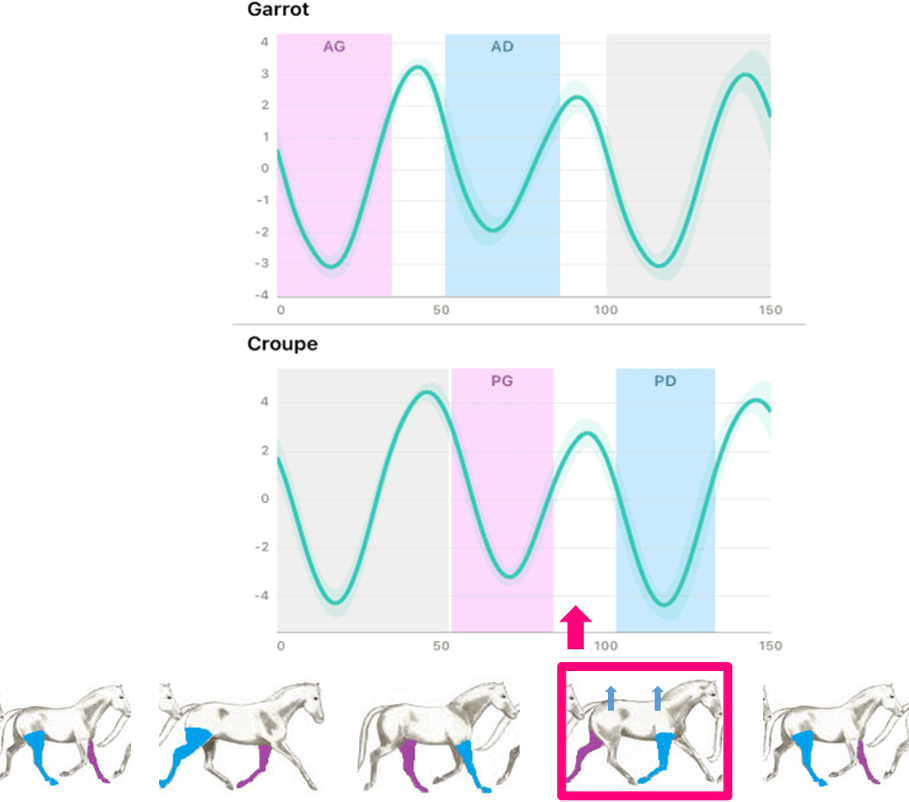
Ground phase – Right diagonal Second suspension phase
The horse is in a landing phase, descending and putting weight on its right front leg and left hind leg.
The horse raises its withers and pelvis after propulsion on the right diagonal (right front leg and left hind leg).
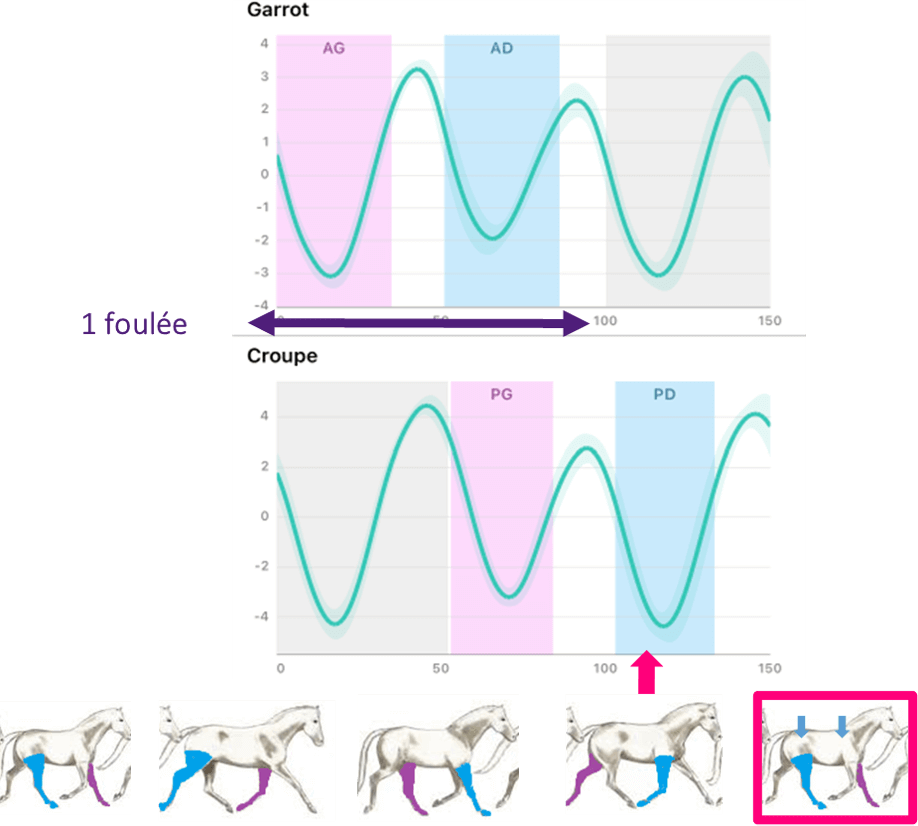
One stride
When the left diagonal is loaded for the second time, the start of the left front leg support marks the end of the stride.
The curves shown above are averages calculated across all strides and presented as an average stride. You can also view all curves/strides before averaging by clicking on the second icon at the top right of your screen.
Read the indices in %
These are expressed as percentages and reflect the horse’s symmetry. They range from -100% to 100%, from the pink zone (left side) to the blue zone (right side), passing through 0% (perfect symmetry).
They are calculated as follows:
(100 x (L value-R value*) ) / (Maximum amplitude)
* L value and R value are respectively linked to the left and right limbs for each desired index: maximum (after propulsion), minimum (after absorption) and amplitude.
Consequently, a positive index value (R<L) indicates a defect in R and a negative index value (L<R) indicates a defect in L.
They are either averaged or available at time t thanks to video synchronisation.
Calculation of support duration
The four sensors on the limbs allow strides to be divided based on the start and end of the ground phase for each limb.
Graphically, these support durations are shown by the pink and blue areas for the left and right limbs respectively. The start of an area marks the start of support for the limb in question, with the foot flat. The end of the zone marks the end of support with the heel lifting off the ground. Between the two: the minimum corresponds to the lowest point of the withers and croup, close to the maximum descent of the fetlocks and therefore the middle of the support phase.